Measuring and Intepreting Intent Conversion
Are Users Actually Achieving Their Goal?
Understanding what users want is only the first step. The real question for an AI-agent product manager is:
Here’s how you access and interpret the Intent conversion from mindlytics portal:
Create a Conversation KPI Chart
In the Mindlytics portal, tap [Create+] button and select Conversation KPI Chart. Conversation KPI Chart translates conversational interactions into measurable outcomes tied to business goals. Synthesizing the conversation, identifying the intent and measuring the ICR for all the intents is automatically done by Mindlytics without the users have to do any configuration.
Apply relevant filters
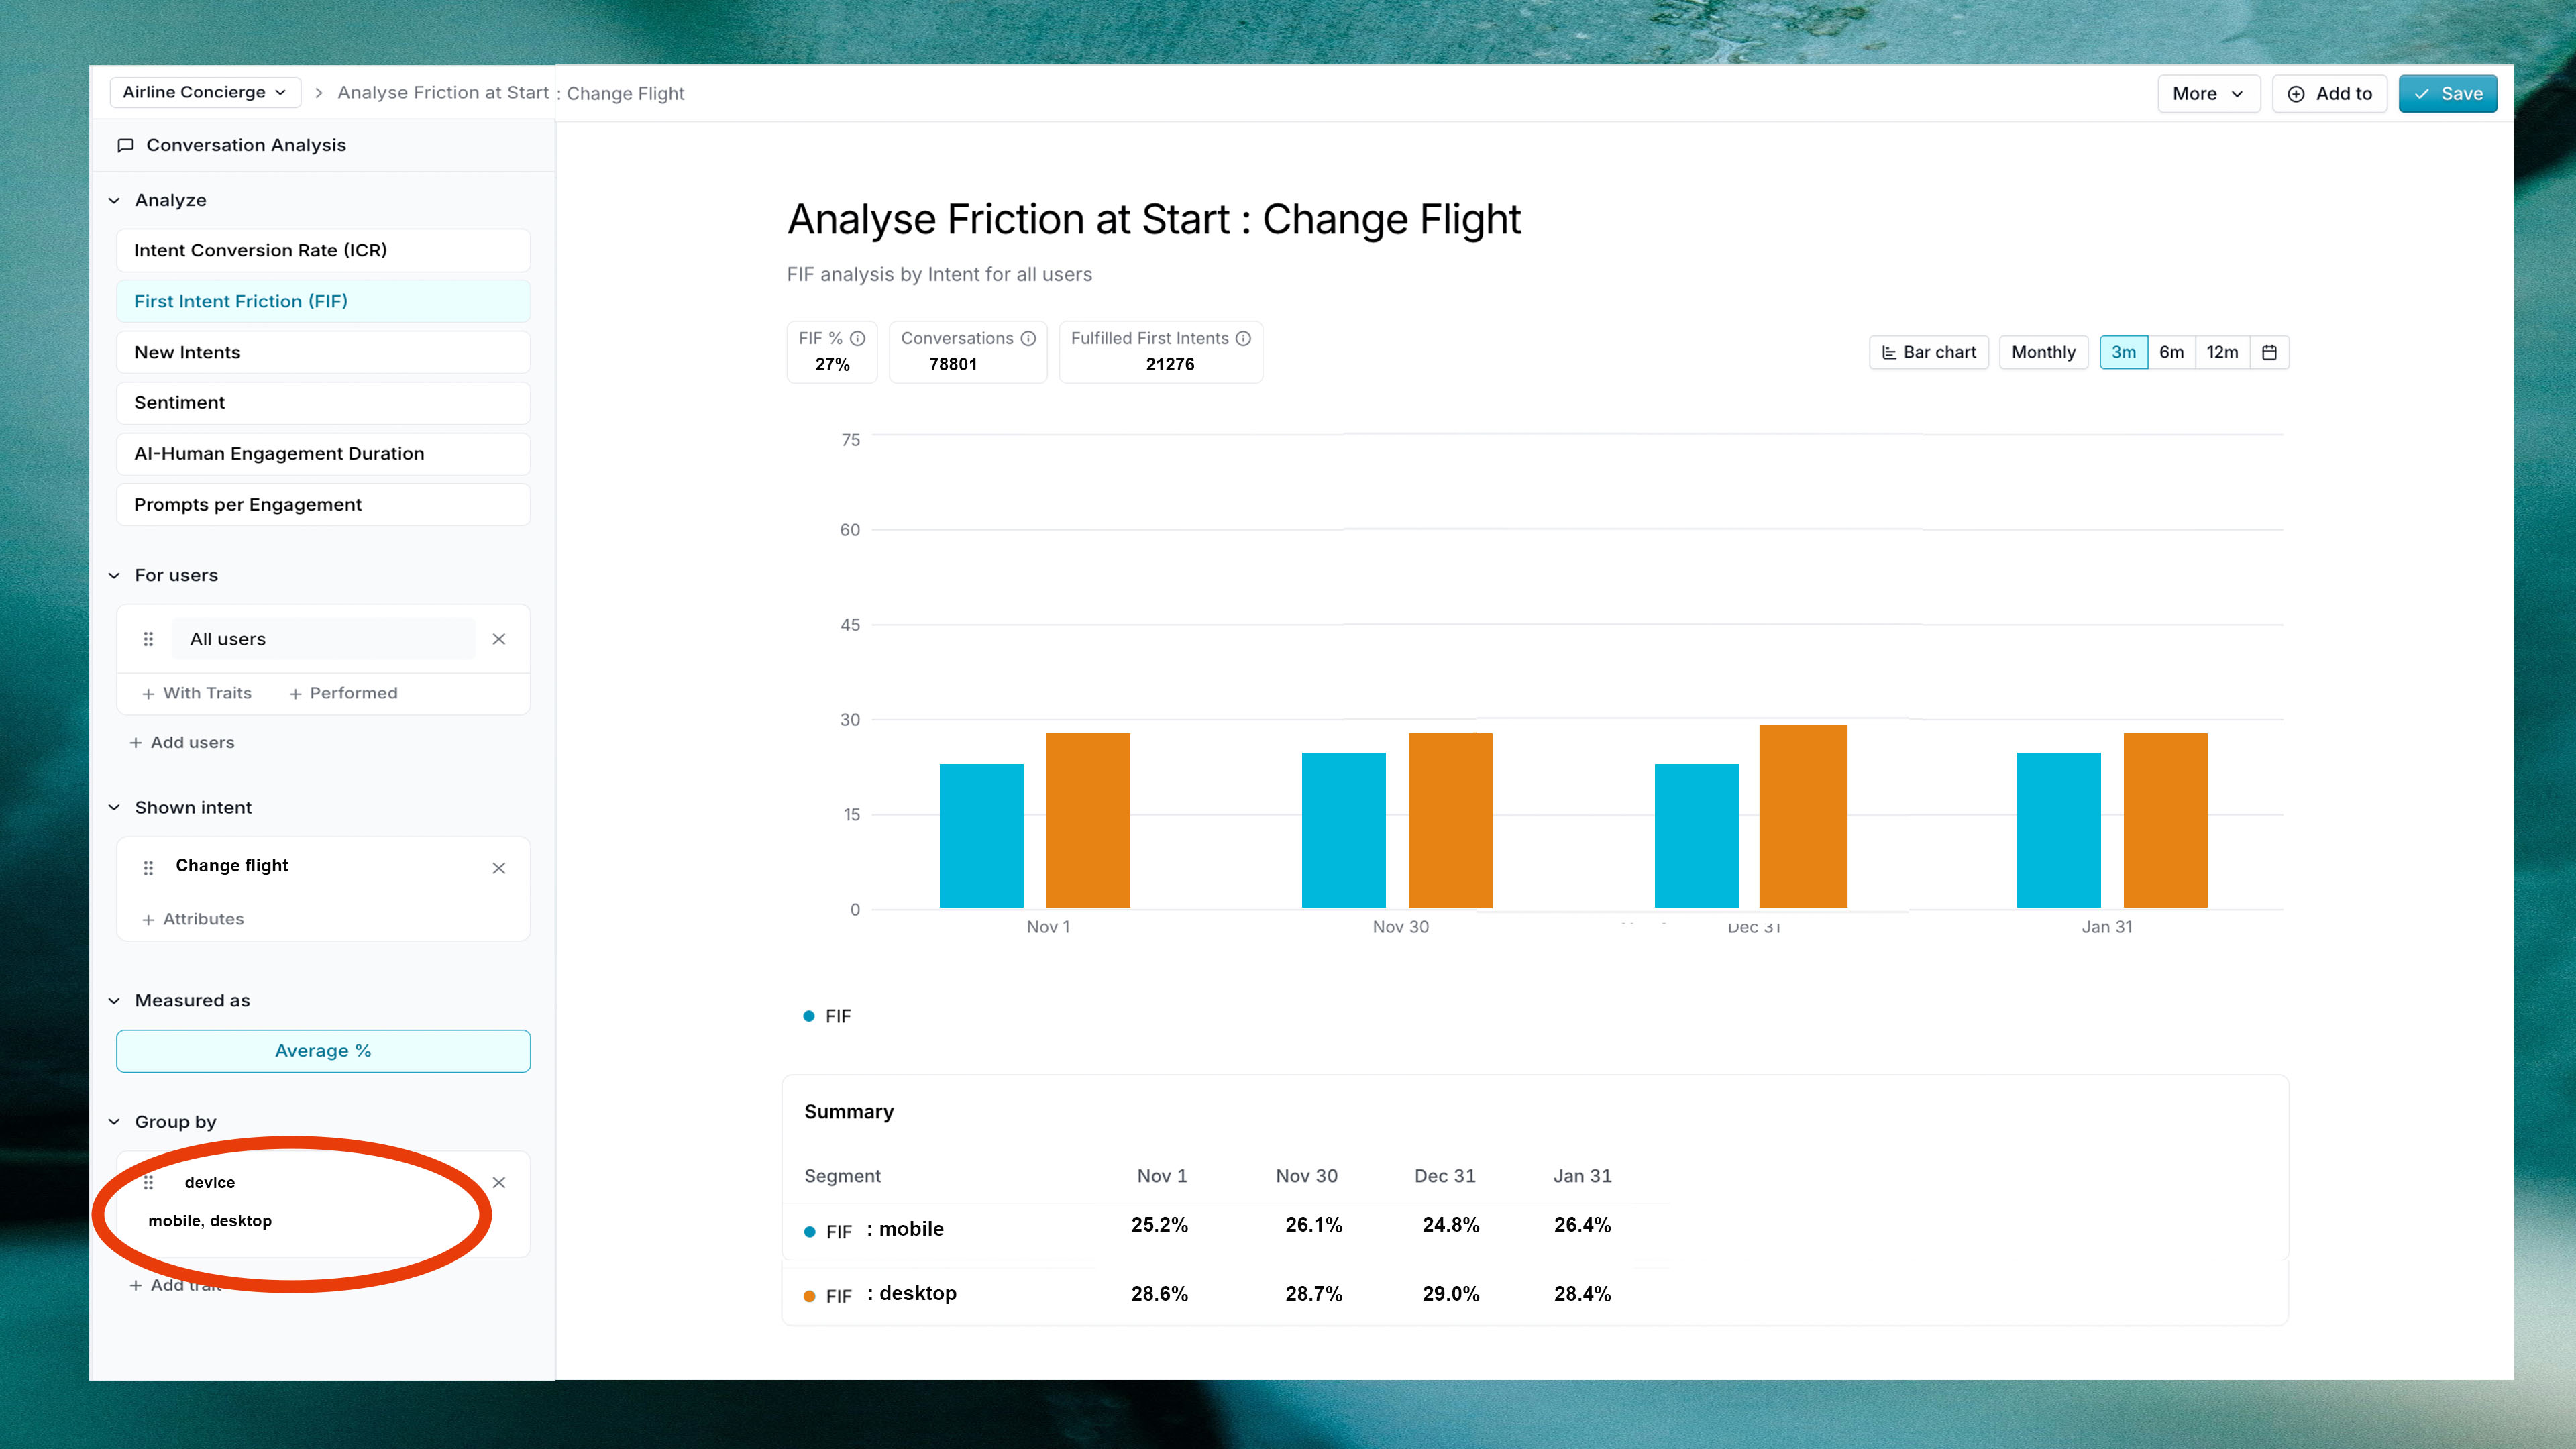
- Select the KPI to track: Make sure Intent Conversion Rate (ICR) KPI button is selected in the filter control panel on the left.
- Compose User List:
- Select Cohort: By default the chart is created using the data from [All Users] cohort (default cohort that includes all active users). You may change the user cohort by clicking the [All User] if you have configured custom cohorts in your app. After selecting the cohort, you may apply filters to narrow down the users to be considered for the chart, as described below.
- Filter users by trait: You can filter users within the current cohort based on user trait values by clicking + With Traits link below the cohort name. For example, if you want to include only male users in the list, you could choose the trait gender with the value equal to "male".
- Filter users by Event: You can also filter users within a cohort based on the EVENTS generated by the user by clicking + Performed link below the cohort name. For example, you could filter users who asked for human agent by filtering by the event Agent Requested
- Merge users across Cohorts: You can merge more users to the list by clicking + Add users below to select more user cohorts and apply custom filters as described above.
- Select the Intent: Select the intent you want to measure ICR for by clicking below Shown intent option on the left filter menu. Mindlytics automatically identifies all the intents appeared in conversations and presents as dropdown options for easy selection.
- Select Date Range: You can choose the data range from the date picker or pick one of the pre-defined date shortcuts.
Lets say, in our airline Concierge agent example, we want to measure the conversion rate when users wanted to change flight. In this case, click below Shown Intent and select
Change flightView and Interpret the Chart
As you apply the filters, the data considered for the chart is modified and the chart is redrawn.
Change flight- November →
58.2% - December →
64% - January →
65.5%
- Prompt refinements that reduce clarification loops
- Improved backend booking API reliability
- Clearer pricing explanations
- Better handling of edge cases
- A new prompt release
- A pricing UI update
- Backend latency improvements
- Better clarification logic